Butterworth filter 란?
통과 대역(passband)의 진폭 스펙트럼이 아주 평평한 주파수 필터
The Butterworth filter is a type of signal processing filter designed to have a frequency response as flat as possible in the passband. It is also referred to as a maximally flat magnitude filter. It was first described in 1930 by the British engineer and physicist Stephen Butterworth in his paper entitled "On the Theory of Filter Amplifiers".[1]
Butterworth filter - Wikipedia
From Wikipedia, the free encyclopedia Jump to navigation Jump to search The frequency response plot from Butterworth's 1930 paper.[1] The Butterworth filter is a type of signal processing filter designed to have a frequency response as flat as possible in
en.wikipedia.org
통과 대역(passband) 란?
필터를 통과 할 수 있는 주파수 또는 파장 범위
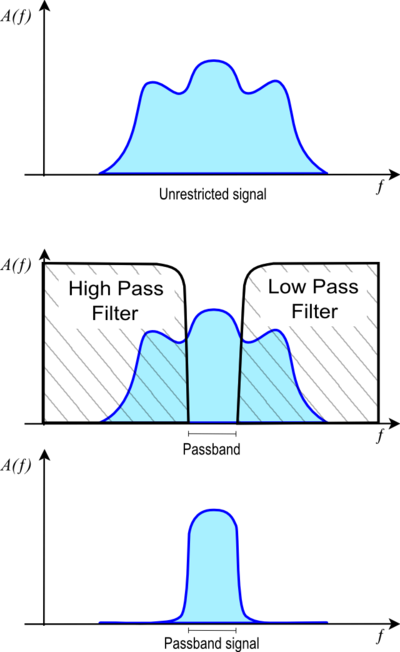
차단 주파수 (cutoff frequency) 란?
어떤 주파수의 신호까지는 통과시키지만 그 이상(또는 그 이하)의 신호는 통과시키지 않는 기능.
In physics and electrical engineering, a cutoff frequency, corner frequency, or break frequency is a boundary in a system's frequency response at which energy flowing through the system begins to be reduced (attenuated or reflected) rather than passing through.

low-pass filter (LPF) 란?
선택된 cutoff frequency 보다 낮은 주파수의 신호를 통과시키는 필터
A low-pass filter (LPF) is a filter that passes signals with a frequency lower than a selected cutoff frequency and attenuates signals with frequencies higher than the cutoff frequency. The exact frequency response of the filter depends on the filter design. The filter is sometimes called a high-cut filter, or treble-cut filter in audio applications. A low-pass filter is the complement of a high-pass filter.

The order of the filter determines the amount of additional attenuation for frequencies higher than the cutoff frequency.

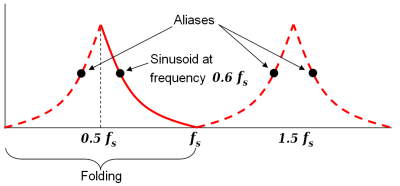
Nyquist frequency 란? (nyq)
샘플링(sampling) 법칙에 의하면 샘플링 주파수 fs는 신호의 최대주파수 성분의 2배 이상이 되어야 한다. 이는 fs/2 이상의 주파수 성문에서는 중첩(folding)현상이 발생하여 알리아싱(aliasing)현상이 발생하기 때문이며, 이때 fs/2를 중첩 주파수 또는 나이퀴스트 주파수라 부른다. 디지털 신호분석 시, 입력신호를 A/D변환기에 의하여 디지털화할 때 N개의 이산화값(discrete value)으로 기록된다. 샘플링 주파수(fs), 나이퀴스트 주파수(f0), 분해는 주파수(Δf)사이에는 다음과 같은 기본식이 성립한다. 즉, fo=fs/2, Δf=fs/N.
[네이버 지식백과] Nyquist Frequency - 나이퀴스트 주파수 (지형 공간정보체계 용어사전, 2016. 1. 3., 이강원, 손호웅)
[python code]
기본 코드
(출처 : https://medium.com/analytics-vidhya/how-to-filter-noise-with-a-low-pass-filter-python-885223e5e9b7)
import numpy as np
from scipy.signal import butter, filtfilt
import matplotlib.pyplot as plt

def butter_lowpass_filter(data, cutoff, fs, order):
	normal_cutoff = cuttoff/nyq
    b, a = butter(order, normal_cutoff, btype='low', analog=Flase)
    y=flitflit(b, a, data)
    return y


T = #period(time interval)
fs = #rate(total number of samples/period)
cutoff = 2 #cutoff frequency

nyq= 0.5*fs
order=2 #filter order
n= int(T*fs) #total number of samples

butter_lowpass_filter(data, cutoff, fs, order)
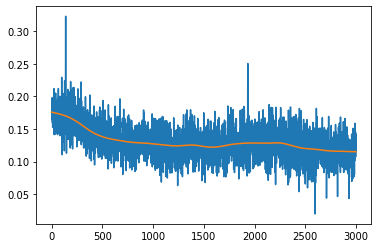
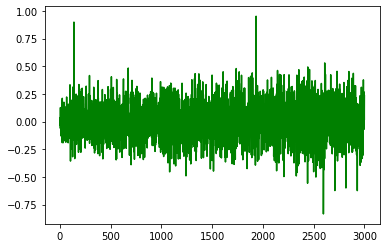
[calcium signal analysis code]


import numpy as np
from scipy.signal import butter, filtfilt
import matplotlib.pyplot as plt

def butter_lowpass_filter(data, cutoff, fs, order):
	normal_cutoff=cutoff/nyq
    b, a = butter(order, normal_cutoff, btype='low', analog=Flase)
    y=filtfilt(b, a, data)
    return y

T = #time interval
fs = #sample rate
cutoff = 2 #sample frequency

nyq = 0.5 * fs
order = 2
n = int(T*fs) #total number of samples

data = #raw data

F=butter_lowpass_filter(data, cutoff, fs, order)
deltaF=(data-F)/F
출처 : wikipedia, NAVER 지식백과
'IT > Python' 카테고리의 다른 글
| python GUI (6) 파이썬 GUI 실행파일 만들기 .py to .exe (pyinstaller) (0) | 2020.04.20 |
|---|---|
| 파이썬으로 signal processing (scipy.signal) (0) | 2020.04.16 |
| PyQt5로 파이썬 GUI 만들기 / python GUI (5) 그래프 그리기, 저장하기 (4) | 2020.03.28 |
| PyQt5로 파이썬 GUI 만들기 / python GUI (4) 시그널/슬롯 (0) | 2020.03.27 |
| PyQt5로 파이썬 GUI 만들기 / python GUI (3) py 코드와 연결하기 (0) | 2020.03.26 |


댓글